Product update from Alunta
See the customers behind every monthly figure
In the Usage trends, Customers with and without payments and New paying customers widgets, you can now click the figures in the monthly table. This opens a list of exactly the customers behind that figure. And lists on the dashboard no longer stop at 100 rows.
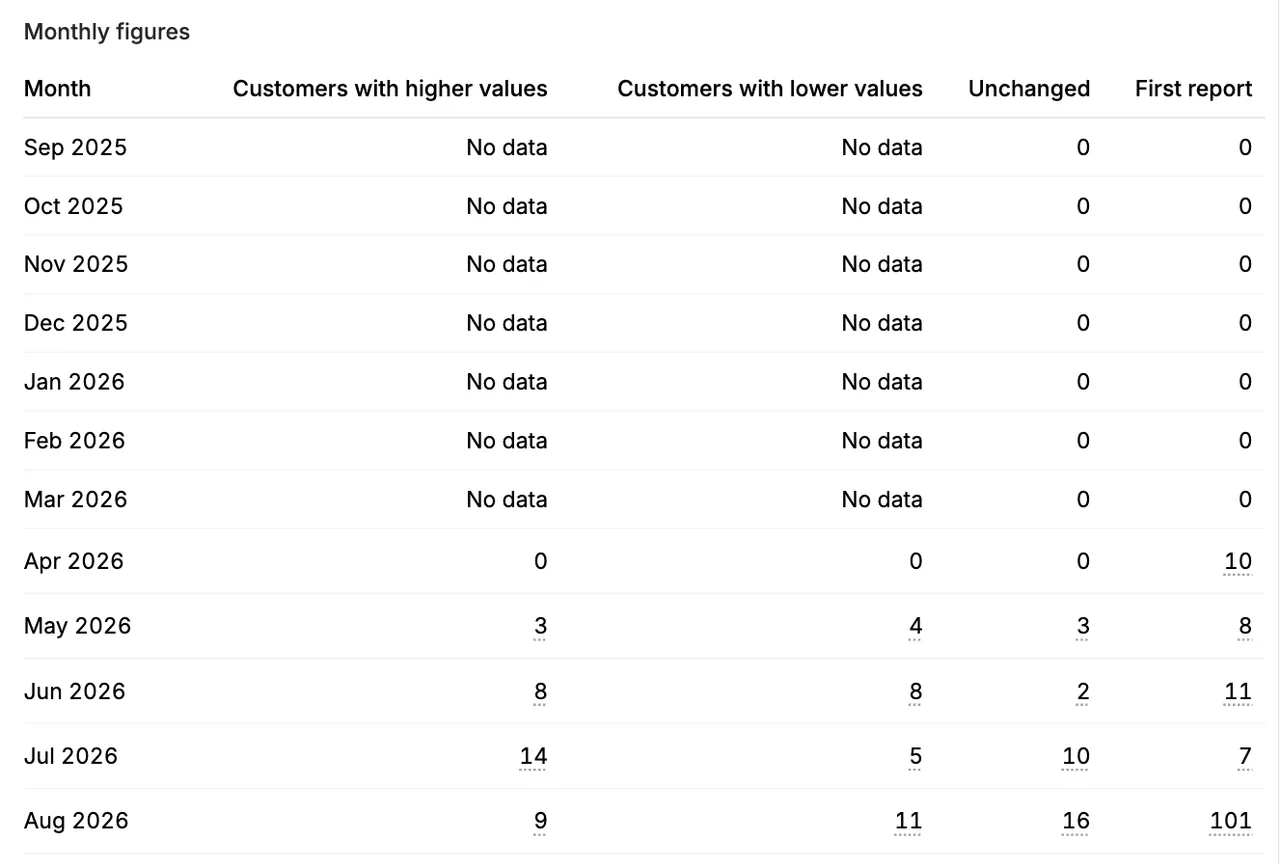
In the Usage trends, Customers with and without payments and New paying customers widgets, you can now click the figures in the monthly table. This opens a list of exactly the customers behind that figure. And lists on the dashboard no longer stop at 100 rows.
The screenshots use fictitious data. Click an image to view it at full size.
Click a figure in the monthly table
Open the details of one of the widgets. Figures with a dotted underline can be clicked. Zeros and months without data cannot.
The list opens on top of the monthly figures, so you can close it and click the next figure. It counts by the same rules as the figure, so the number of customers and the total at the bottom always match what you clicked.
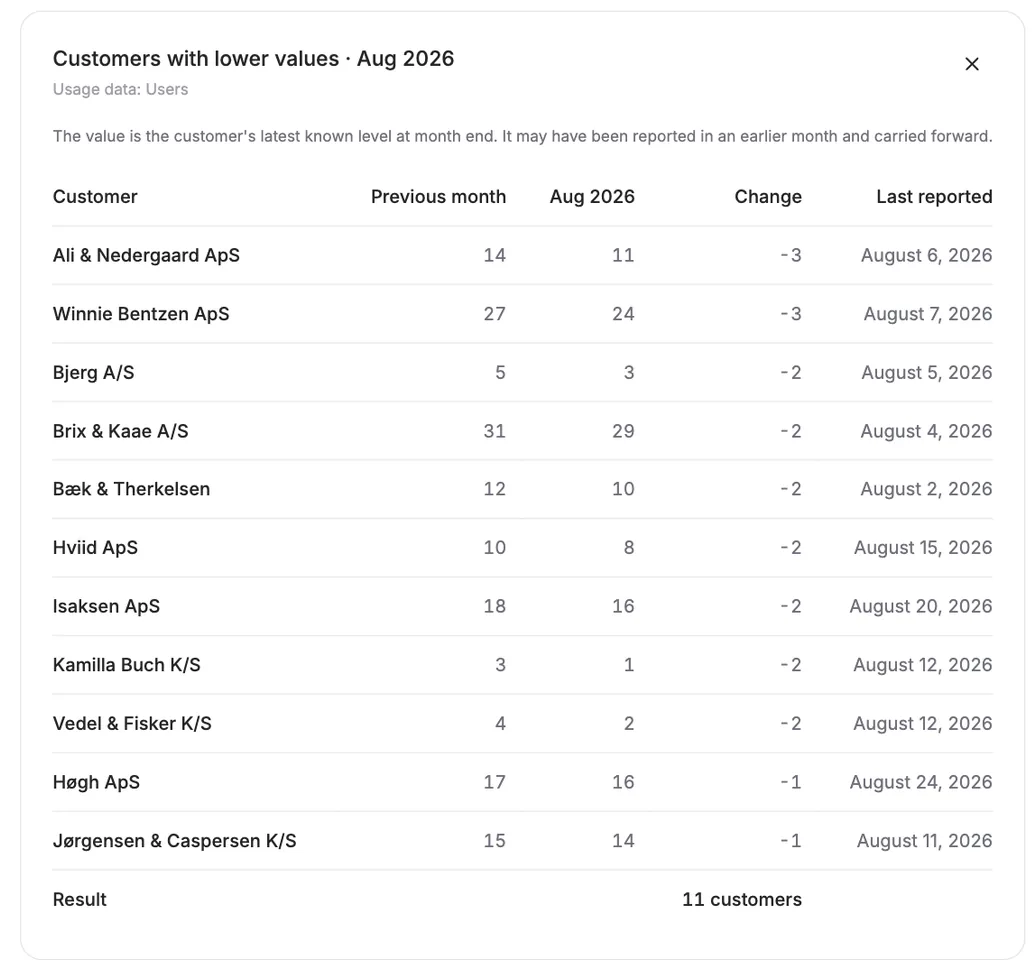
The list shows what explains that particular figure:
- Usage: the customer’s value for the month and when it was last reported. For customers with higher or lower values, you also see the previous month’s value and the change, with the largest changes first. A value can be carried forward from an earlier month, which the date shows.
- Customers with payments: the number of payments in the month and the latest payment.
- Customers without payments: when the customer last paid, or whether it never has.
- New paying customers: the date of the customer’s first payment.
Click a customer’s name to go to the customer. Customers that have since been deleted are marked “deleted”.
See every row on the dashboard
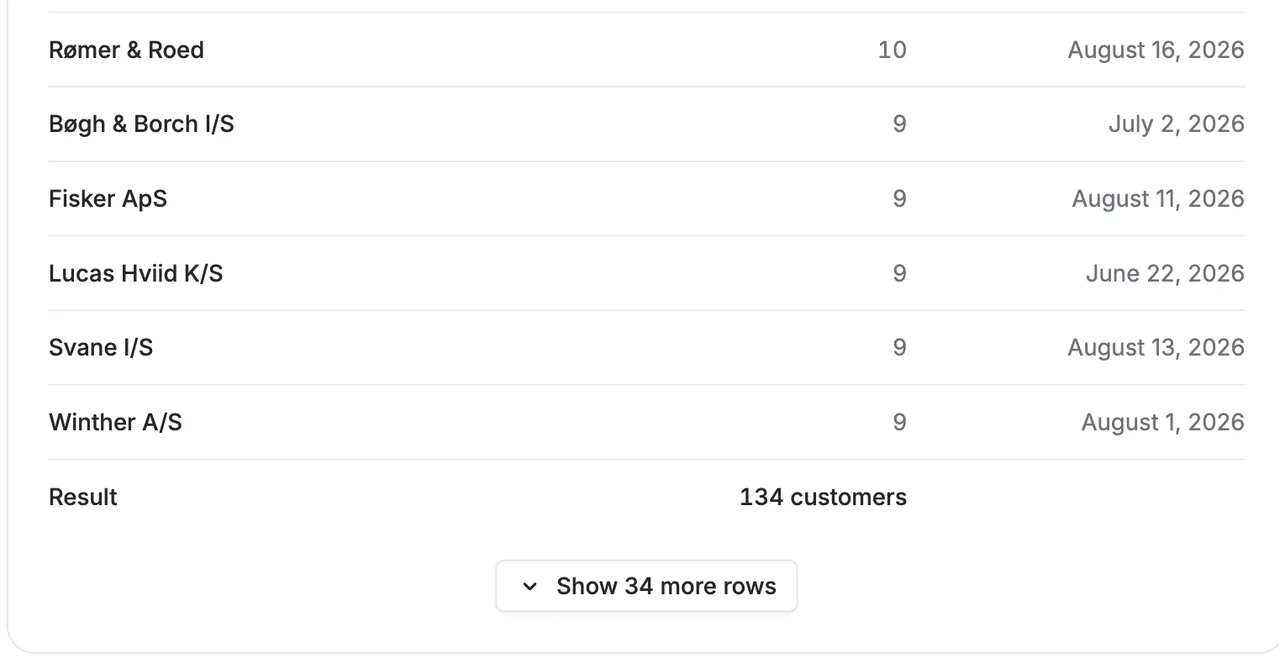
Lists on the dashboard used to show at most 100 rows, such as the customers behind your MRR, active subscriptions or overdue invoices. They now show the first 100 and a button to see 100 more at a time until the whole list is shown. The result at the bottom has always counted every row.


The people and AI helpers behind the updates
Bo Møller and Emil Højbjerg are the primary developers behind Alunta. They spend most of their time coding, so they have delegated the wording of these explanations to our AI helpers.
The AI helpers write from the updates we have deployed to the product. Bo and Emil are behind the changes and remain responsible for ensuring the information reflects what was actually released.